hOMES: Weekly Insight Into Hoboken and Downtown Jersey City Real Estate Trends | JUNE 30, 2017
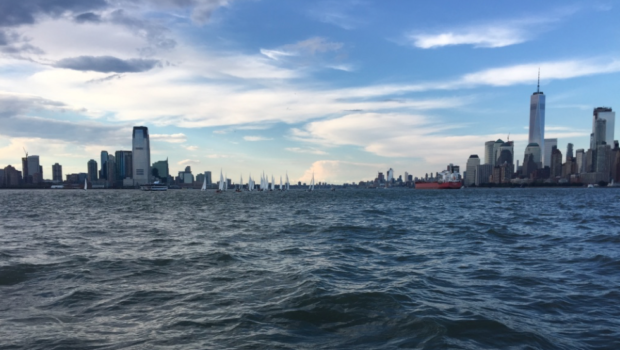
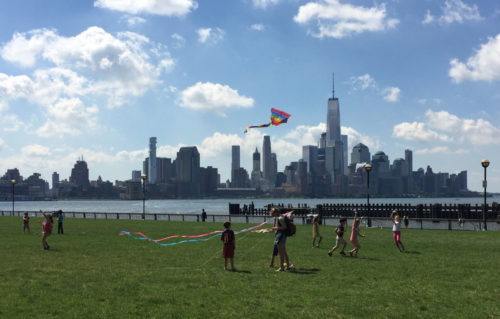
(ABOVE: photo taken aboard Rib New York)

 Hoboken Real Estate Trends | June 30, 2017
by Ann Wycherley
Broker Associate, Century 21 Innovative Realty
Happy July 4th Weekend!
As we reach the halfway point in the year, we felt it would be a good idea to review the condo market and look at the numbers based on the past six months. We have compiled stats based on active, under-contract and sold listings.
Across the board Downtown Jersey City was slightly more expensive than Hoboken. What is interesting to note is that as prices and prices per sq/ft have risen slowly and steadily over the past six months, the average days on the market has also increased. For sold properties the average number of days is 16-18 days, which is a reflection on the busy Spring market that we had. But the current active listings are now on the market for 32-41 days. The main reason for this is seasonal, people tend to take a break from house hunting during the summer months. But there are still a good number of active properties on the market—so if you are currently house hunting, there are a lot of terrific options out there.
HOBOKEN:
Studio/ 1-Bedrooms
Active Listings:
38 active listings. The average price is $535,740 and the average price per sq/ft is $750. The average number of days on the market is 32.
Pending Sales:
52 pending properties. The average price is $509,820 and the average price per sq/ft is 721. The average number of days on the market is 18.
Sold Properties:
104 sold properties. The price was $35,740 and the price per sq/ft was $769. The average number of days on the market is 16
2-Bedrooms
Active Listings:
60 active listings. The average price is $860,899 and the average price per sq/ft is $744. The average number of days on the market is 37.
Pending Sales:
89 pending properties. The average price is $837,123 and the average price per sq/ft is 719. The average number of days on the market is 23.
Sold Properties:
120 sold properties. The average price was $811,341 and the average price per sq/ft was $710. The average number of days on the market is 16.
3- & 4-Bedrooms
Active Listings:
41 active listings. The average price is $1,533,459 and the average price per sq/ft is $758. The average number of days on the market is 41.
Pending Sales:
29 pending properties. The average price is $1,413,717 and the average price per sq/ft is 759. The average number of days on the market is 23.
Sold Properties:
43 sold properties. The average price was $1,307,434 and the average price per sq/ft was $718. The average number of days on the market is 16.
DOWNTOWN JERSEY CITY:
Studio/ 1-Bedrooms
Active Listings:
47 active listings. The average price is $647,470 and the average price per sq/ft is $819. The average number of days on the market is 35.
Pending Sales:
45 pending properties. The average price is $636,243 and the average price per sq/ft is $826. The average number of days on the market is 29.
Sold Properties:
63 properties closed. The average price was $637,808 the average price per sq/ft was $836. The average number of days on the market is 16.
2-Bedrooms
Active Listings:
35 active listings. The average price is $1,000,933 and the average price per sq/ft is $815. The average number of days on the market is 39.
Pending Sales:
53 pending properties. The average price is $850,284 and the average price per sq/ft is $756. The average number of days on the market is 29.
Sold Properties:
73 properties closed. The average price was $861,301 and the average price per sq/ft was $731. The average number of days on the market is 23.
3- & 4-Bedrooms
Active Listings:
20 active listings. The average price is $1,559,819 and the average price per sq/ft is $815 The average number of days on the market is 36.
Pending Sales:
4 pending properties. The average price is $1,177,249 and the average price per sq/ft is $763. The average number of days on the market is 30.
Sold Properties:
19 properties closed. The average price was $1,319,205 and the average price per sq/ft was $784. The average number of days on the market is 22.
(Information provided by Hudson County MLS)
CLICK HERE to learn more about these and other properties…
 CLICK HERE to find out how much your property is worth in today’s market…
Mortgage Market in Review:
We’ve seen mortgage rates trend up slightly this week, as the bond market has sold off and the equity markets have rallied. As volume in the market decreases heading into the holiday weekend, a lot of the activity will be viewed as hollow. Markets are open on Monday, but with the 4th of July on a Tuesday this year, expect even lower volume than what we are going to see at the end of this week. All in all, mortgage rates have still been stable. Whether or not the current trend continues after the holiday remains to be seen, and will ultimately determine whether or not this trend upward is for real.
CLICK HERE for a more detailed analysis from local mortgage broker Michael Mundy…
ALSO OF INTEREST:
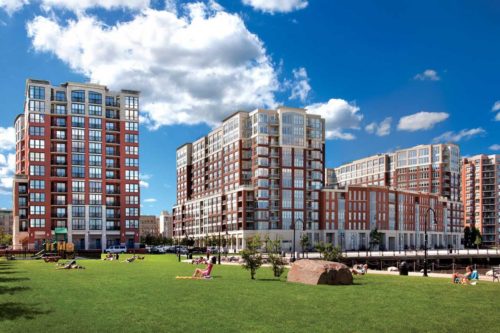 Changes to Final Phase of Maxwell Place Approved (JerseyDigs.com)
 Easy Tips For Staging Your Home with Toddlers Around (RISMedia)
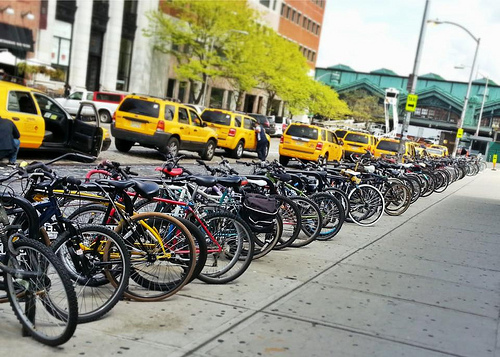 City of Hoboken Auctioning Off Abandoned Bicycles (hobokennj.gov)
*****************
Ann Wycherley is an award-winning realtor with over 15 years of solid real estate experience in the Hoboken and Jersey City market.
She has been recognized by the New Jersey Realtors Circle of Excellence for many years, having earned the Gold Level of Excellence for 2015 and 2016, meanwhile awarded Lifetime Membership in the New Jersey Association of Realtors Distinguished Sales Club.
Other accolades include the coveted Centurion Award for the past five years running (2012-2016), which represents the premium level of achievement within the Century 21 organization.

 Previous Article
 Next Article
 hOMES: Your Weekly Insight into Hoboken Real Estate Trends | FEB. 19-25, 2016
  THE WORST: Methodological Mystery Poll Names Hoboken Worst in NJ for Families
  Texas Hold ‘Em / Blackjack at Hoboken Catholic Academy — FRIDAY
  hOMES: Your Weekly Insight into Hoboken Real Estate Trends | JUNE 3-9, 2016
  WATCHFUL EYE: DeFusco Calls for Increased Surveillance Along Hoboken Waterfront Amidst Debate Over Effectiveness
  Art Reception at the W Hotel Hoboken — Dec. 12th
  Fridays Are For Frank: “Sand and Sea” (Special Hoboken Seal Edition)
  Tony Boloney’s Says “No Mas” to Donald Trump